Big Data (Coming Soon)
Powered by Elastic, Clusterlogics has integrated a full suite of big data analytics into our platform. Seamlessly install and configure on any Server or Virtual Machine (VM) configured within the platform. Any Server or VM, no matter where it’s located, can be quickly and easily configured, via a wizard based GUI. Gain insights into every server in your environment. Configure notifications and centralize both your Backup and DR strategy, along with your Monitoring, Server Performance Data and Application Performance Management (APM). Comprehensive and clear analytics and reporting allowing you to proactively maintain healthy environments, while also providing valuable insights into your Application and Database performance. Utilize our API to pull this data into any system or portal you require, receive notifications if something is unusual, and quickly identify server and application issues in a simple graphical format.
 Cloud Enabled
Install and configure Big Data Analytics and APM tools from a simple to use wizard GUI interface. Automatically connect and configure to any Server or Virtual Machine, whether in house, or in the public cloud.
 Infrastructure Analysis
Advanced Infrastructure and Application metrics are made available in easy to read graphical interfaces. Combined with advanced reporting, enable a proactive approach to managing your infrastructure and services, and quickly and easily enable even junior administrators to identify, isolate and resolve problems.
 Built on top of Elastic
Built on top of the www.elastic.co Open Source Platform. Elastic is a lightweight, full featured, big data platform. A mature platform, trusted by System Administrators everywhere to aggregate, sort and report on data from any number of variable sources. The Clusterlogics platform is built on Open Standards and operates on commodity hardware. Full featured API allows for extensive integration capabilities.
The amount of data being generated within server and cloud environments and networks is simply incredible.
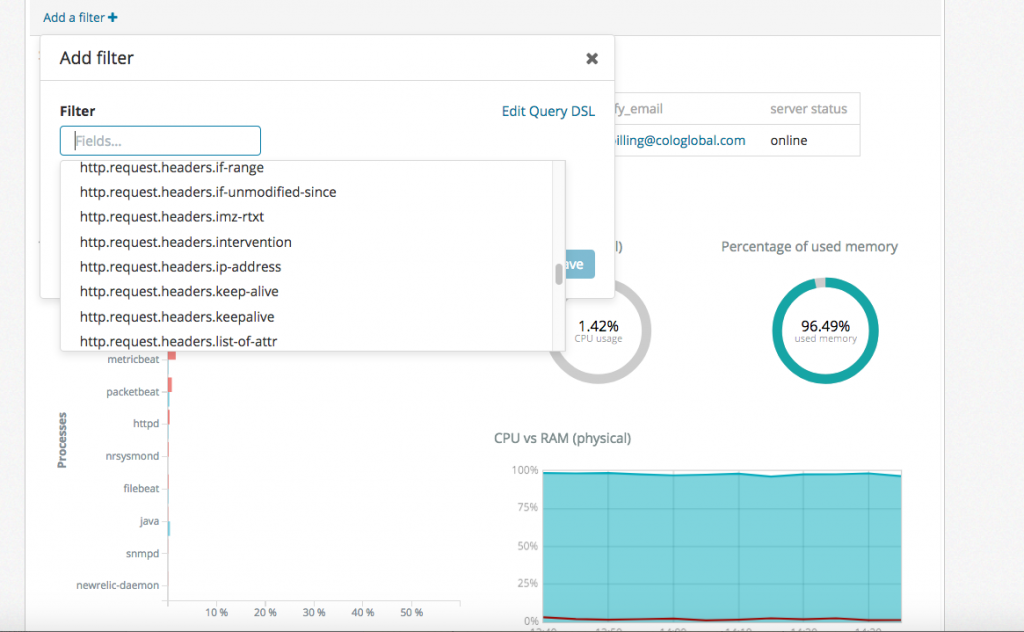
We have pre-built all sorts of dashboards and views (see below), however, customers are also able to create and customize their own views. Whether they are concerned with APM data, data to assist them in tracking down errors in their code, access data, or anything else they require, it can be accomplished from within the GUI, by customizing queries to your specifications. Customers without senior technical resources can take advantage of our full screen of pre-configured dashboards, data, and views which will allow them to easily see and understand the most important aspects of their environment.
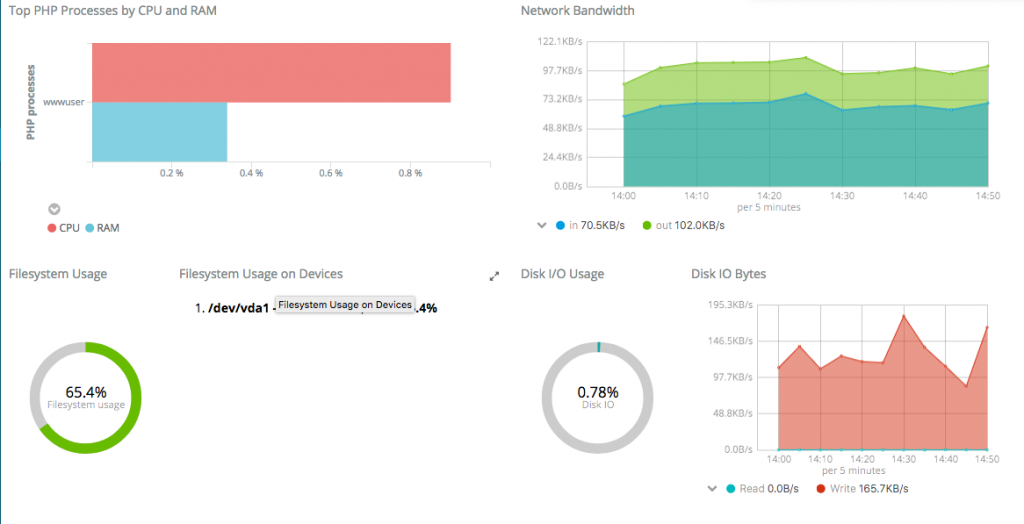
Whether it is something as simple as PHP processes and a breakdown of resources used by each PHP process, or file system, disk space and IOPs usage, this platform will produce what you need.
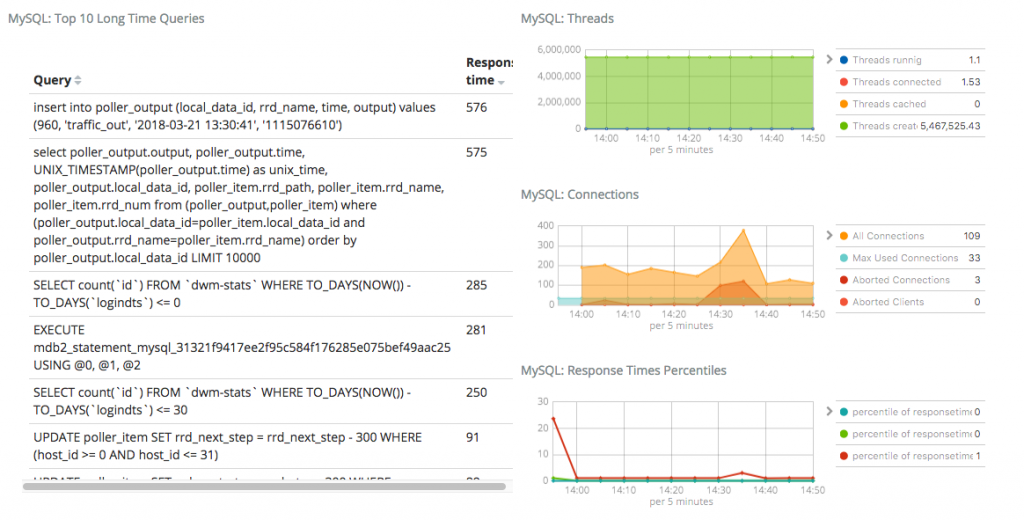
For more complex items like monitoring slow Database (ie MySQL) queries, and overall MySQL performance, response, and activity level, our pre-built Dashboards offer you everything you need to have a full and complete view into your Managed environments. Other data we include is Redis caching dashboards, Apache and IIS interfaces, along with some extensive APM data options for advanced developers.
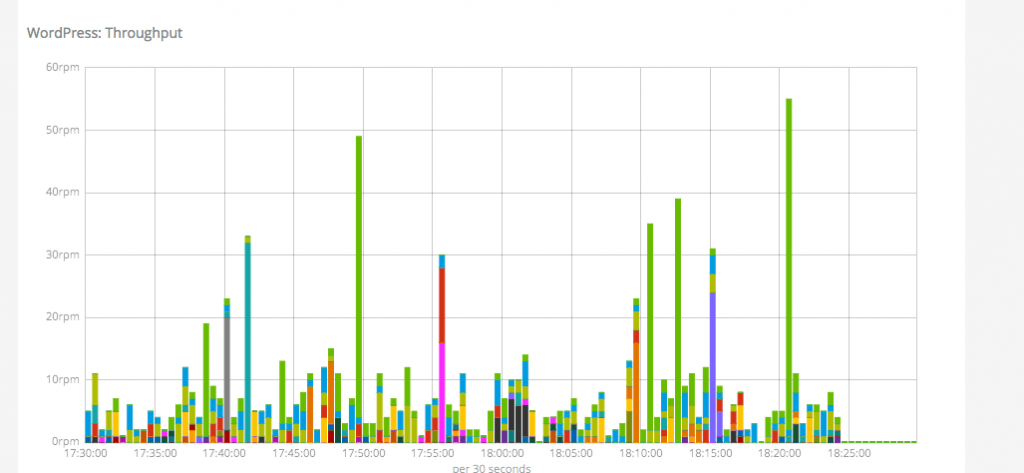
For all the WordPress developers and providers out there, we have a very tight integration with WordPress, showing you the performance of all of your installs, who is generating errors, who’s WordPress installs are loading slowly, and most importantly, the CPU and RAM usage of each WordPress install you are hosting and managing.